Showing posts with label Technical Analysis. Show all posts
Showing posts with label Technical Analysis. Show all posts
Wednesday, May 16, 2007
End of a Chapter
Dearest friends, bloggers and passer-bys,
Its been two months since I started this blog and with great sadness, I am closing this blogging chapter of my trading journey. I sincerely thank everyone for their support either by participation or just reading the articles posted here. I noticed its even a breakout - 10,000 hits :).
After meeting the masters over the weekend, I realised the disparity is great, so great that I am left with no choice but to close this blog to find time. Time to strengthen my foundation, time to relearn what I have learned, time to unlearn what I have learned, time to get in tune with Nature.
Final Notes of My Stand
Luck
I do not know about luck but I know this - Luck is when Preparation meets with Opportunity. Yes, I have emphasized a lot about Preparations over and over again in my blog. Without proper preparation, one cannot capitalise on opportunities that arise. What is the will to win, if there is no will to prepare?
Continuous Learning
I have yet to meet with a master that thinks that no more learning is needed. A true master would never stop learning. The three masters I met have such high level of skill and yet, they are discovering new things each day. They have yet to stop learning, they knew one thing - when they took on this path, this trader's path, they have made the market their best teacher and vowed to continuously learn from it.
I have always correct anyone who tried to call me sifu. I know that they only meant respect or maybe out of politeness but seriously, I am unworthy. I have yet to attain such level of skill. I have yet to achieve anything that is worth shouting about. I have to decline the title.
Trading Plan
Before a trade is even made, a trading plan MUST, I repeat, MUST be drawn up. Else, one would be at serious disadvantage. In the market, we are up against people with more money than we have, more skill than we have. How can we possibly stand a chance if we do not even have a plan?
Stop Loss and Trailing Stops
To me, this is imperative, irregardless whether one is a trader or an investor. Perhaps the stop point would be different, but nonetheless, this is a life saver. Anyone who lived through the recession periods would understand this concept. Or they better do.
Even the most fundamentally strong company would not be spared. To watch your investment decline 80% of its value is not an easy sight. And it tests every bone of your body as an investor. Yes, the stock is undervalued but it may remain so. Yes, it will rebound - some day but you may need the cash. You may get retrenched, your children may need to further their studies, there could be other emergencies, countless and endless possibilities. In recession, Cash is King.
Average Down
I have not recommended anyone to average down. Its like compounding the initial error. Now, what about investors, should they average down? I do not know about shoulds or shouldn'ts but I know this - you may average down SUBJECTED TO identification of critical points where beyond would render the average down and the initial entry wrong and stop loss MUST be executed - this means an impeccable discipline and emotional control.
Feel the Market
Several months earlier, I was chatting with booffett - who draws chart with pen and graph paper. It was my lack of understanding that computers could replace this function. I am beginning to appreciate drawing charts by hand. I am drawing 50 charts per day by hand and I hope to increase this number. ;)
Nature
I speak about Nature. It may be too complicated to explain but remember the most important indicators where all are derived from - Price, Volume and Time.
Price, Volume and Time. Master this and the world will be your oyster.
Moving forward
For Fusion Picks - which I must add was not really successful, remember to place stops and trade according to initial plan.
Market - From what I see, the general KLSE is weak, while KLCI is strong. Bullish uptrend is expected to continue despite May Factor etc. However, remember your stops. Never forget them.
Stocks - KLCI or related should perform and give a better chance of success.
Futures - Well, doubt futures traders would find any comment from me useful. See you in battlefield :P.
Resources
There are many resources around on the net - this means tremendous savings in money - rather than buy books or attending seminars, one could read and learn by themselves. The money would be better spent paying for tuition to the market.
Kenneth Factor
Just in case anyone thought this is for Kenneth Factor, do visit this link - under the comments section. I take this as a peace treaty signed between Kenneth and myself. I have nothing further to add.
Steps
Brian McKnight has this song - Back At One. For trading there are steps too:
1) Learn
2) Analyse
3) Backtest
4) Foreward Test
5) Trade
6) Post Mortem
7) Back to (1)
And to Make Money from Trading
All that is needed is this -
1) Trading System
2) Emotional Control
3) Money Management and Discipline
Oh, if anyone is looking for me
I ll be around in forums, or you could mail me directly. :)
Once again, thank you everyone for your kind support and patronage.
Good Luck and Happy Trading!

Saturday, April 28, 2007
Ebook: Dr Alexander Elder 2
And so, I left out the actual Entry and Exit book from my original post. Heh heh.
Here it is.

Alexander Elder - Entry & Exit
As usual, you are advised to download the ebook(s) soonest possible before the link expires or removed. I m not responsible of providing fresh links if they are no longer working.
EDIT: I forgot to give credit to Mr CS Ong for finding and sharing this ebook with me.
Here it is.
Alexander Elder - Entry & Exit
As usual, you are advised to download the ebook(s) soonest possible before the link expires or removed. I m not responsible of providing fresh links if they are no longer working.
EDIT: I forgot to give credit to Mr CS Ong for finding and sharing this ebook with me.
Thursday, April 26, 2007
The Yin & Yang of Candlesticks

Everything in the universe has a balance. And the balance is seen in yin and yang.
So does candlestick. To ease our memory of the patterns in candlestick, we need to understand the concept of yin and yang.
Let's take a look at this candle - irregardless of whether it is a black or white candle - is this a hammer or a hanging man?

Without knowing the previous trend, one would not know but to learn this, it is easiest to learn both together. Even Nison grouped them together in his book Japanese Candlestick Charting Techniques.
The hammer and hanging man can be recognized by three criteria:
1. The real body is at the upper end of the trading range. The color of
the real body is not important.
2. A long lower shadow should be twice the height of the real body
3. It should have no, or a very short, upper shadow.
The only difference is one appears on the uptrend, signalling potential downtrend; while the other is the exact opposite - appears on the downtrend signalling potential uptrend.

"What is in a name?" - Shakespeare.
But if you would really want to remember the name, an easy way is visualisation - for example, hanging man - I would visualise that to be hanging, one needs to be on a high position - so hanging man would be hanging on the uptrend, signalling on potential downtrend. Why signal potential downtrend? Well, after being hanged, one would be dead. Kind of obvious isn't it?
And if hanging man and hammer is the exact opposite and one has learnt the hanging man, what would be the hammer? Yeap. the exact opposite. Easy, isn't it?
Now look at the below, what is this - a Shooting Star or an Inverted Hammer?

Again the concept to learn is the same as the above illustration of the Hanging Man and the Hammer.
Hopefully this article would ease one's learning on the Candlesticks. Enjoy!
Wednesday, April 25, 2007
Ebook: Dr Alexander Elder

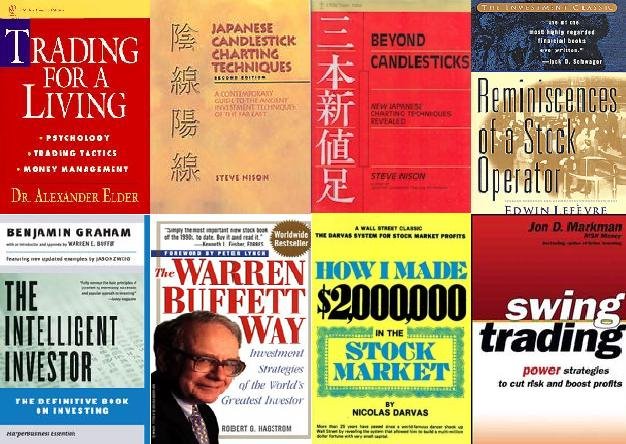
Dr Alexander Elder writes one of the best basic trading book covering from the right mindset, winning attitude, money management, and to essential technical knowledge.
Read all about it in Trading For a Living

After Trading For a Living, Dr Alexander Elder restrengthen and refortifies the principles to trading in Come to My Trading Room.

Maybe one still would have doubts. Perhaps Dr Alexander Elder is a genius. A rare exception. How could we mere mortals hope to emulate his successes? In the book, Study Guide to Entries and Exits, you will be shown to 16, yes 16 individuals who have different trading capitals base and levels of experience but are equally successful. They're all traders. :)
As usual, you are advised to download the ebook(s) soonest possible before the link expires or removed. I m not responsible of providing fresh links if they are no longer working.
Sunday, April 22, 2007
Leading and Lagging Indicators
I've always held the belief, and still do, that all indicators are lagging. Indicators are based on past price volume action, hence lagging. However, this is my personal belief.
Mainstream wise, TA indicators are grouped into Lagging Indicators and Leading Indicators.
Lagging Indicators

Trend indicators fall into this category as they assist us in identifying the underlying trend based on past movement. This would include indicators such as Moving Averages.
As per my previous post - One shoe size fits all, I had a section on Crossover with Moving Averages as examples - terms such as Golden Cross and Dead Cross should be a familiar term.
When a Golden Cross appears, it is normally after the change of trend has already occurred fo sometime, ie, not the first sign of trend change.
Same goes to a Dead Cross, the downtrend is already obvious from the price movement itself - hence why it is labelled as a lagging indicator.
So since it is lagging, why do we need these Lagging Indicators? Well, actually, we don't really "need" them. However, they assist in helping us to "visually see" the trend continuation. As for trend reversals, they are confirmations that trend reversals has already happened.
These Lagging Indicators can also be used as entry points for Fundamentalists whose Trading/Investing Plan mainly focuses on FA. A simple TA method to use for Fundamentalist is actually Moving Average Crossovers. A reliable indicator for safe entry when the holding period is for the longer term.
Leading Indicators

Leading indicators are those which are used to predict price movement - or potential trend reversals. Indicators such as the RSI would fall into this category.
As per my previous post - One shoe size fits all, I had many sections which demonstrates how it could be applied in practice.
So why is this considered Leading? Well, the idea is that these indicators are supposed to be used to predict the future price movement - as the key reversal point are being formed.
However do take note that, Leading Indicators are best used in a Trading Range rather than a Trending Market. Sometimes, an oscillator can remain overbought or oversold condition for some time, remember?
So anyway, there, a summary of leading and lagging indicators. A trading system, in my opinion, should have a mixture of these two elements as they do complement each other. One to identify early trend change, another to confirm and provide continuation signals.
Mainstream wise, TA indicators are grouped into Lagging Indicators and Leading Indicators.
Lagging Indicators

Trend indicators fall into this category as they assist us in identifying the underlying trend based on past movement. This would include indicators such as Moving Averages.
As per my previous post - One shoe size fits all, I had a section on Crossover with Moving Averages as examples - terms such as Golden Cross and Dead Cross should be a familiar term.
When a Golden Cross appears, it is normally after the change of trend has already occurred fo sometime, ie, not the first sign of trend change.
Same goes to a Dead Cross, the downtrend is already obvious from the price movement itself - hence why it is labelled as a lagging indicator.
So since it is lagging, why do we need these Lagging Indicators? Well, actually, we don't really "need" them. However, they assist in helping us to "visually see" the trend continuation. As for trend reversals, they are confirmations that trend reversals has already happened.
These Lagging Indicators can also be used as entry points for Fundamentalists whose Trading/Investing Plan mainly focuses on FA. A simple TA method to use for Fundamentalist is actually Moving Average Crossovers. A reliable indicator for safe entry when the holding period is for the longer term.
Leading Indicators

Leading indicators are those which are used to predict price movement - or potential trend reversals. Indicators such as the RSI would fall into this category.
As per my previous post - One shoe size fits all, I had many sections which demonstrates how it could be applied in practice.
So why is this considered Leading? Well, the idea is that these indicators are supposed to be used to predict the future price movement - as the key reversal point are being formed.
However do take note that, Leading Indicators are best used in a Trading Range rather than a Trending Market. Sometimes, an oscillator can remain overbought or oversold condition for some time, remember?
So anyway, there, a summary of leading and lagging indicators. A trading system, in my opinion, should have a mixture of these two elements as they do complement each other. One to identify early trend change, another to confirm and provide continuation signals.
Thursday, April 19, 2007
The HOLY GRAIL

In the ancient tombs of Pharaoh Tutankhamen of
But beware! It is also rumored that the scroll of the Holy Grail is protected by the spirits of the Pharaoh’s himself! One wrong move, and the ancient spirits will descend a terrible curse on the unlucky one for seven generations.

This however, would merely mean nothing to the treasure hunters. Every year, new bands treasure hunters would emerge to embark a journey to seek this magical scroll of the Holy Grail.
Haha, thanks for indulging me with a little drama – just for humor J

However, allow me to share an excerpt from Van Tharp’s Trade Your Way to Financial Freedom, in which, I owe my gratitude to Mr CS Ong, I presume :)
The “Holy Grail” is not some magical source that is the key to the markets, as most people believe. The metaphor of the “Holy Grail,” according to scholars like Joseph Campbell, is all about finding yourself. Similarly, the “Holy Grail” in the markets - the key to unlocking profits - is all about finding yourself.
To unlock the “Holy Grail,” you need to appreciate your own ability to think and be unique. People make money by finding themselves, achieving their potential, and getting in tune with themselves so that they can follow the flow of the market.
Getting in tune with yourself means finding an inner peace inside. It means finding a balance between profits and losses. The Holy Grail is not a magical trading system; it is an inner struggle.
Once you’ve discovered that, and resolved the struggle, you can find a trading system that will work for you

“If you look far, it’s very far away,
If you look near, it’s right before your very eyes”
- Chinese Proverb
Wednesday, April 18, 2007
John Bollinger on Bollinger Bands

What is Bollinger Bands?
Bollinger Bands is a trading band indicator. It is an indicator that envelops the prices of a certain stock. It does NOT give a definitive buy or sell signal. However, it indicates an answer if the prices are relatively high or relatively low.
One of the great joys of having invented an analytical technique such as Bollinger Bands is seeing what other people do with it. While there are many ways to use Bollinger Bands, following are a few rules that serve as a good beginning point.
- Bollinger Bands provide a relative definition of high and low.
- That relative definition can be used to compare price action and indicator action to arrive at rigorous buy and sell decisions.
- Appropriate indicators can be derived from momentum, volume, sentiment, open interest, inter-market data, etc.
- Volatility and trend have already been deployed in the construction of Bollinger Bands, so their use for confirmation of price action is not recommended
- The indicators used for confirmation should not be directly related to one another. Two indicators from the same category do not increase confirmation. Avoid colinearity.
- Bollinger Bands can also be used to clarify pure price patterns such as M-type; tops and W-type bottoms, momentum shifts, etc.
- Price can, and does, walk up the upper Bollinger Band and down the lower Bollinger Band.
- Closes outside the Bollinger Bands can be continuation signals, not reversal signals - as is demonstrated by the use of Bollinger Bands in some very successful volatility-breakout systems.
- The default parameters of 20 periods for the moving average and standard deviation calculations, and two standard deviations for the bandwidth are just that, defaults. The actual parameters needed for any given market/task may be different.
- The average deployed should not be the best one for crossovers. Rather, it should be descriptive of the intermediate-term trend.
- If the average is lengthened the number of standard deviations needs to be increased simultaneously; from 2 at 20 periods, to 2.1 at 50 periods. Likewise, if the average is shortened the number of standard deviations should be reduced; from 2 at 20 periods, to 1.9 at 10 periods.
- Bollinger Bands are based upon a simple moving average. This is because a simple moving average is used in the standard deviation calculation and we wish to be logically consistent.
- Be careful about making statistical assumptions based on the use of the standard deviation calculation in the construction of the bands. The sample size in most deployments of Bollinger Bands is too small for statistical significance and the distributions involved are rarely normal.
- Indicators can be normalized with %b, eliminating fixed thresholds in the process.
- Finally, tags of the bands are just that, tags not signals. A tag of the upper Bollinger Band is NOT in-and-of-itself a sell signal. A tag of the lower Bollinger Band is NOT in-and-of-itself a buy signal.
Monday, April 16, 2007
EBooks: Nicholas Darvas

How I Made $2 Million in the Stock Market
Darvas Flow Chart
These ebooks are available for download in Blisswind Google Group.
And many more! Join today!
Hehe, good promotional gimmick, huh? But hey, it won't cost you anything :)
Friday, March 23, 2007
Support and Resistance

Definition according to Investopedia
Support is the price level which, historically, a stock has had difficulty falling below. It is thought of as the level at which a lot of buyers tend to enter the stock.
Resistance is the price at which a stock or market can trade, but which it cannot exceed, for a certain period of time.
Breakout is a price movement through an identified level of support or resistance, which is usually followed by heavy volume and increased volatility. Traders will buy the underlying asset when the price breaks above a level of resistance and sell when it breaks below support.
Breakdown is price movement through an identified level of support, which is usually followed by heavy volume and sharp declines. Technical traders will short sell the underlying asset when the price of the security breaks below a support level because it is a clear indication that the bears are in control and that additional selling pressure is likely to follow.

Confusing. Hmm, for once, Investopedia's definition actually is confusing.
Let's see if this critic can do a better job :P
Let's go back to the the definition of Technical Analysis post where I said that market is ultimately about Supply and Demand. What drives this - Supply and Demand? Perception.
The perception that the current price is cheap in relative to its future price - hence a buy.
The perception that the current price is expensive in relative to its future price - hence a sell.

So, based on psychology, my definition would be
Support is where market players think the price is cheap in relative to future price
Resistance is where market players think the price is expensive in relative to future price
Breakout is where previous Resistance level is broken as market players think that price will be higher in the future
Breakdown is where previous Support level is broken as market players think that price will be lower in the future

There are several ways to identify support or resistance.
1) Gaps
Western Technicals uses gap. The Japanese equivalent would be the Rising Window and Falling Window of the candlestick pattern. Hence, it is more of a zonal support and resistance rather than a specific point. Confirmation of breakout required – to test the staying power.
2) Consolidation point
This is where a period of consolidation is used as a zonal support and resistance.
Say a stock went from a downtrend 3.00 and stayed in consolidation in 2.50. After a while it resumed the downtrend to 2.00 before rebounding. The 2.50 zone will be a primary resistance point. The idea is that people who were holding the stock at 2.50 may not have cleared its position. The longer the consolidation period, the higher the strength of support and resistance.
3) Highest/Lowest point
Using the most recent highs or lows as support and resistance. The idea behind this is that when it reaches the recent highs or lows, the general perception is that the stock is expensive or cheap. Hence a good time to sell or buy.
4) Fibonacci levels
The technique of using 23.6%, 31.8%, 50% and 61.8% as a measure of overreactions in price actions. This would be covered under a separate post.
5) Pattern’s Technical Target
The idea is that when a pattern breakout occurs, there is a technical target. Assuming there is a number of pattern technical analysts, then the selling or buying point has been reached. Not a good indicator of support and resistance due to the self-fulfilling nature of Patterns Method.
6) Previous Support becomes a Resistance. Previous Resistance becomes a Support. The idea is simple. Previous support, a lot of buyers went in.
However, a breakdown occurred. Some cut loss. Some have not.
Those who have not, would be content to get out at small gain/loss or breakeven.
Hence the Resistance is formed.
Hereby offer you all in one chart for your reference.
Sample: Proton

Wednesday, March 21, 2007
Ditching Two Methods

Like in school when we were made to study various subjects which probably would have no bearings in our lives.
I was from the Science Stream and now, all the Physics, Biology, Chemistry are poured down the drain.
Instead of pursuing a science driven career, I went ahead with Accounting.
In the course of my journey in Trading, as I've mentioned previously in My Journey of Learning, I have learned various methods - Candlestick, Indicators, Patterns and Elliott Wave.
Today, I am resolve to ditch two methods:

1. Patterns
I have deep affinity for this method. This patterns was one of my favorite.
It basically revolves around a breakout system with a target price.
It may also suggest additional top up entries
However, the drawbacks are as follows:
1) if you have to cringe you eyes to see the pattern, its not there.
2) If you are the only one to see the pattern, its going to fail.
3) If you are the last one to see the pattern, its going to fail.
4) Price pattern is a self fulfilling prophecy. You need a lot of other trader think alike to make it work.
5) Different trader may act differently to make the price pattern fail.
6) Price pattern will not give you an "edge" because it is observable by anyone.

What it means by "self-fulfilling prophecy" is that the more people use this method, the more this method will work. And if no one uses this method, it will fail.
One of the famous quote which was used and reused, basically overused, is Mao Zedong's "It doesn't matter whether a cat is black or white, so long as it catches mice."

For me to advance another level in TA, I must disagree.
I must not leave my fate to mere chance.
Hence, I must use only the right way. And sad but I must, ditch this method.
2. Elliott Wave

I am also ditching this method.
Some of you who knows me, probably know I am a defender of Elliott Wave Theory. My method of usage is slightly different. However, while this method does work, there are many areas of subjectivity.
Also, the major problem I have with this method is myself.
I find myself too prone to predicting the market and trying to time the market even though, I keep stressing that one must not do so.
This is a trading sin which I am guilty of and of which everyone should be aware and avoid.

So what does it mean?
Well, it basically means, I am consolidating my methods.
Henceforth, I shall rely mainly on candlestick - which shows the price movement; and indicators - which assist me to decipher the price volume movement.

I am getting closer to nature, I think.
Will I be handicapped if I ditch this two methods?
Let's see - a pattern is based on breakouts.
Breakouts are based on trendlines.
Pattern targets - well, I ll missed them, but I ll substitute with Resistance Concept.
Elliott Wave, Well, I ll miss this tool too, frankly speaking.
But wave identification is also based on breakouts.
Breakouts of which is based on trendline & resistance.
Targets? I ll substitute with the same - Resistance Concept.
However, every now and then, I may decide to publish some of the abandoned methods just for educational and entertainment purposes. You may get some ideas from the two methods mentioned above and used it on your own trading strategies/style.
One shoe size fits all

I am a lazy fellow. So here is one general concept that could fit with most indicators. However, do be aware that since I am generalising here, there are some that may work on certain indicators, and some don't.
Ok, let's get technical :)
Sample chart here is KLCI.
Sample indicator here is RSI.
There are few methods to do it.
1. Fixed Numbers
For different indicators, it would be different numbers but the concept is the same.
For RSI, the recommended is 30 oversold and 70 for overbought
The idea is of contrarion. Buy when market is selling. Sell when market is buying.
So, Buy signal when oversold condition seen.

Sell when overbought condition seen.

2. Trendline
For price action, many draw trendlines. For Indicators, we could also do the same.
The whole idea is the same:
When resistance is broken, buy.

When support is broken, sell.

3. Midline
For some indicators, the midline is zero.
For RSI, the midline is 50.
The idea about this is continuation and also the concept of support and resistance.
50 is the middle ground. So it should be the contention of the bulls and the bears.
When crossover upwards, its a buy signal.

When crossover downwards, its a sell signal.

4. Divergences
Basically the idea of divergences is that when the indicator does not move in line with the price. The idea is that accumulation or distribution may be at work and the price does not show it. Hence, the hidden power of indicators.
Buy when positive divergence is seen.
Positive divergence means that Price goes down or neutral but the indicator shows uptrend.

Sell when negative divergence is seen.
Negative divergence means that Price goes up or neutral but the indicator shows downtrend.

5. Crossover
Basically here we will be using Moving Averages as our sample indicator.
Lets use the popular Exponential Moving Average (EMA) 50 days and 20 days
Basically the idea is simple. When the EMA of shorter period crosses the EMA longer period its a signal.
Buy when crosses up. This is also known as the Golden Cross.

Sell when crosses down. This is also known as the Dead Cross.

Legends:
EMA 50 - Purple Line
EMA 20 - Orange Line

Disclaimer: While the charts may look wonderful, as if all the signals work, in reality it does not. It look fantastic because I made it look so. I only show you the ones that work, too lazy to upload more charts that show how it does not work. Parameters/settings of the indicator also come into play. As I do not use RSI, I could not advise you the settings :P. Self analysis is strongly advised. Best to fit to own trading strategy/trading style.
Sunday, March 18, 2007
Why I say ROI 20% per annum is no big deal
For those who know me, you must have seen my postings about ROI 20% pa is not a problem.
Some may think I am crazy. Some may think I am boastful.
But since I have launched this blog, allow me to share my observation and experience in KLSE.

Consider this: Stock market in general moves in cycles.
We have many theories revolving around this concept.
Buddhism believes in recarnation, that's a cycle.
The Economic Cycle theory states that the economy moves in a cycle.
The Dow Theory (one of the oldest theory still applicable) states that the market has three phases - accummulation phase, public participation phase and distribution phase. Sounds like a cycle to me.
The Elliott Wave revolves around cycles.
Everything is a cycle.
OK, let's look at charts. Enough theory for now :). Below is the KLCI chart from 1990 to 2007 (Friday). Chart data courtesy of Mr Lim of www.bizfun.cc

From the charts, what can we observe?
Now if you have said, Cycles, no prize for guessing it right :P
Now, let's zoom in to the more recent developments.

What do you see again?
Yeap, cycles.
Perhaps, the zoom is insufficient, indulge me, look at another zoom.

What do you see?
One complete small cycle.
Question: So from our observation, we concluded that stock market indeed move in cycles. So how to we profit from it?
Question: Why is this post titled: Why I say ROI 20% per annum is no big deal.
Question: Why does every Tom, Dick and Harry say, Buy Low, Sell High
(Or, in Ben's terms, Buy Sheep, Sell Deer, hahaha)

Hmm, so you must be thinking, "Ok, so your point is that stock market moves in cycle and if we want ROI 20% pa, we should buy low sell high. Big deal. How the heck are you going to do it? Can you actually catch the bottom and the peak?"
If so, then allow me to answer you, I cannot pick the exact bottom nor the exact high.
However, let me ask you another question, (you know what they say, one question leads to another :) ), Do you seriously need to pick the exact bottom or the exact high to achieve ROI 20% per annum? Note 20% pa. Not 30% pa. Not 50% pa. Not 100% pa.

To traders, this is insufficient. We ll cover some trader's techniques in the future.
To investors, 20% ROI is a heaven sent gift! The banks are not going to give you an FD rate of 20% pa. Neither does any stock issuing a Dividend Yield of 20%.
Of course, now that I have your attention, and possibly your belief that ROI 20% is possible, and its no big deal, you must be thinking, So how do you identify the cycle?

Well, this is the fun part. Now that the curiousity has been aroused, I m going to leave you with that thought. Hahaha. Curiousity may have killed the cat. But as Ben say, Satisfaction will bring it back. So, imagine if you solve the riddle all by yourself. Imagine the satisfaction :)
Otherwise, worry not, stay with us at Fusion Trader.
One day, you know what I mean :)
Some may think I am crazy. Some may think I am boastful.
But since I have launched this blog, allow me to share my observation and experience in KLSE.

Consider this: Stock market in general moves in cycles.
We have many theories revolving around this concept.
Buddhism believes in recarnation, that's a cycle.
The Economic Cycle theory states that the economy moves in a cycle.
The Dow Theory (one of the oldest theory still applicable) states that the market has three phases - accummulation phase, public participation phase and distribution phase. Sounds like a cycle to me.
The Elliott Wave revolves around cycles.
Everything is a cycle.
OK, let's look at charts. Enough theory for now :). Below is the KLCI chart from 1990 to 2007 (Friday). Chart data courtesy of Mr Lim of www.bizfun.cc

From the charts, what can we observe?
Now if you have said, Cycles, no prize for guessing it right :P
Now, let's zoom in to the more recent developments.

What do you see again?
Yeap, cycles.
Perhaps, the zoom is insufficient, indulge me, look at another zoom.

What do you see?
One complete small cycle.
Question: So from our observation, we concluded that stock market indeed move in cycles. So how to we profit from it?
Question: Why is this post titled: Why I say ROI 20% per annum is no big deal.
Question: Why does every Tom, Dick and Harry say, Buy Low, Sell High
(Or, in Ben's terms, Buy Sheep, Sell Deer, hahaha)

Hmm, so you must be thinking, "Ok, so your point is that stock market moves in cycle and if we want ROI 20% pa, we should buy low sell high. Big deal. How the heck are you going to do it? Can you actually catch the bottom and the peak?"
If so, then allow me to answer you, I cannot pick the exact bottom nor the exact high.
However, let me ask you another question, (you know what they say, one question leads to another :) ), Do you seriously need to pick the exact bottom or the exact high to achieve ROI 20% per annum? Note 20% pa. Not 30% pa. Not 50% pa. Not 100% pa.

To traders, this is insufficient. We ll cover some trader's techniques in the future.
To investors, 20% ROI is a heaven sent gift! The banks are not going to give you an FD rate of 20% pa. Neither does any stock issuing a Dividend Yield of 20%.
Of course, now that I have your attention, and possibly your belief that ROI 20% is possible, and its no big deal, you must be thinking, So how do you identify the cycle?

Well, this is the fun part. Now that the curiousity has been aroused, I m going to leave you with that thought. Hahaha. Curiousity may have killed the cat. But as Ben say, Satisfaction will bring it back. So, imagine if you solve the riddle all by yourself. Imagine the satisfaction :)
Otherwise, worry not, stay with us at Fusion Trader.
One day, you know what I mean :)
Tools of Trade

I love to cook - whenever I find the time that is.


So prior to cooking, I always have the ingredients out and ready.
Trading is the same.
We need the ingredients ready before we could start.

First, we need Metastock.
You can obtain it from http://www.equis.com
No need to mention my name. They have no idea who the heck am I.

Then for End of Day (EOD) data, you ll need to obtain from http://www.bizfun.cc
You can tell Mr Lim you were referred to by Max, but I doubt you ll get any discount.
His data is practically free already. Only one-time payment of RM80 for historical data.
Monthly data and daily data is free of charge.
Where to find such kind hearted person?
So, don't ask for discount. In fact, recommend all your friends to buy from him.
This is a call to support the nice guys movement.

However, in office, I do not have Metastock, so I needed an alternative.
Tradesignum comes into mind - www.tradesignum.com
Marcus and Daryl are also nice guys.
Free data. Free software.
Where to find?
Support them. :)
Support them. :)


Or for Hardcore Traders, you ll need additional tools.
This is where Telequote and Nextview comes into mind.
Realtime data with indicators for a fee.
You can request for trial period.
Personally, I find Telequote is much better.
They sent their salesman over.
Nextview didn't bother about retailers like me :(, or maybe I m just not charming enough.
But you decide.
Telequote - www.tq.net
Nextview - http://www.thenextview.com/
Oh yeah, no need to mention Max. They don't know who is Max :P
So there. Ingredients, oops I mean, the tools of trade.
Happy cooking, oops I mean, Happy Trading :P
Subscribe to:
Posts (Atom)